Sport, physical activity and health; mixed enthusiastically using physics and science
Author: stevehaake
Steve is a physcist and Professor of Sports Engineering at Sheffield Hallam University. He was awarded an OBE in 2020 for services to sport, science and education.
Tuesday 4th August 2026. Each week, between 2.30pm and 3pm, I talk to Sonja McLaughlan on Track Radio about technology and sport.
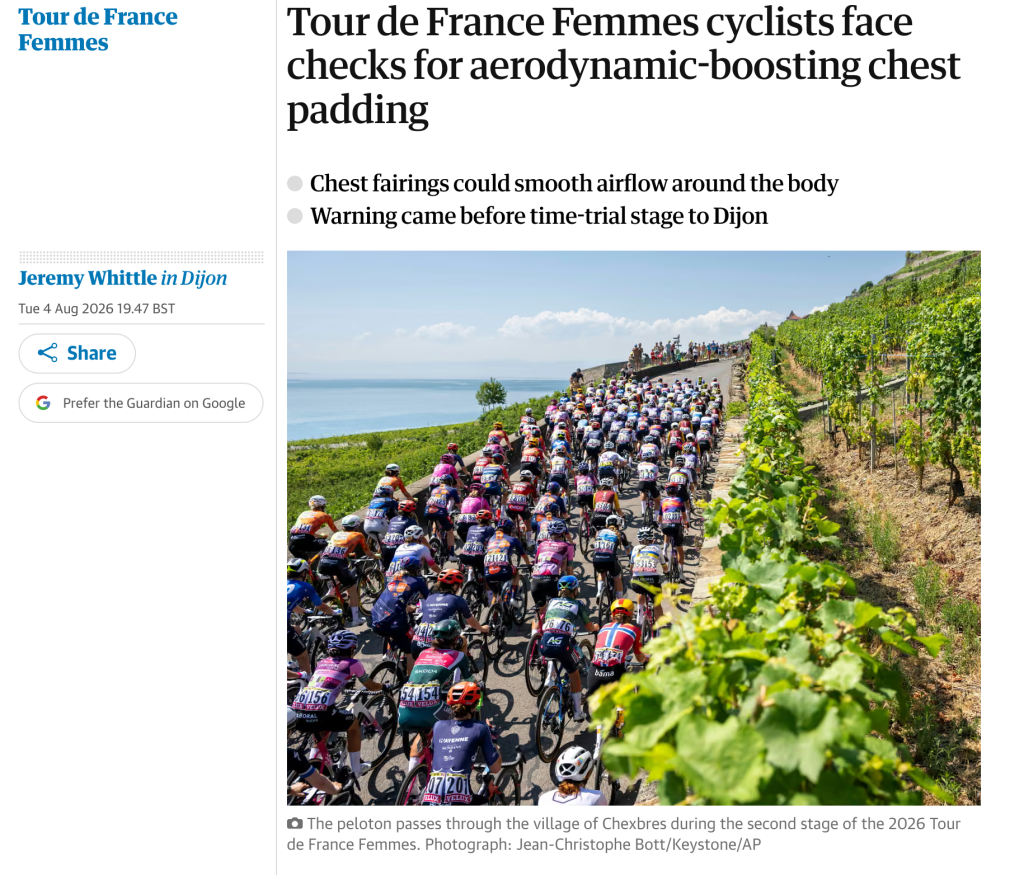
This week had an extra slot following the announcement by the UCI that they would be checking female riders for any extra chest padding that might give an aerodynamic advantage. This was the story that emerged in the Guardian and other media outlets.
There were claims that some women riders had padded their chest area with ice or other materials. Allegedly, this smoothed the airflow over the body, reducing power lost due to drag by a few percent, enough to be a performance boost. This was very much against UCI rules.
Does this really work? And if so, how?
How to reduce drag without anyone noticing
There are really only two things a rider can control when it comes to drag from the air. The first is the area presented to the oncoming air. We learn what to do from an early age: remember going down a hill as a kid and trying to go as fast as possible? You hunch down to streamline your body and automatically make yourself as small as possible. The drag is directly proportional to your cross sectional area: reduce your area by 10% and the drag goes down by the same amount.
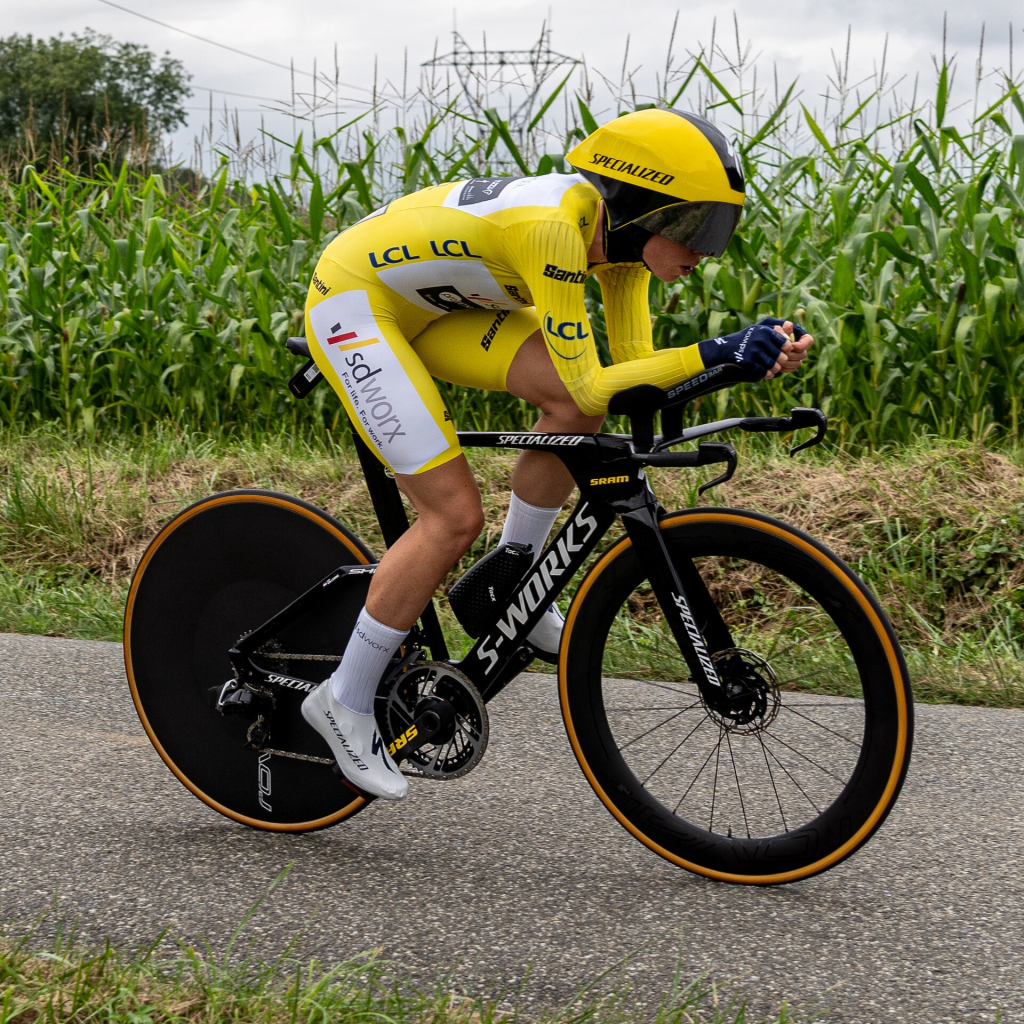
The second thing you can control is a bit more elusive and concerns the way in which the air flows over the body. This is embodied in a number called the drag coefficient. Like the cross-sectional area, reduce this by 10% and you reduce your drag by 10%. Cyclists use lots of tricks to do this: aero helmets, clothing with ribulets to channel airflow, shaved legs and so on. The key task is to make the air flow smoothly over the body and separate as close to the rider’s rear with as small a wake as possible.
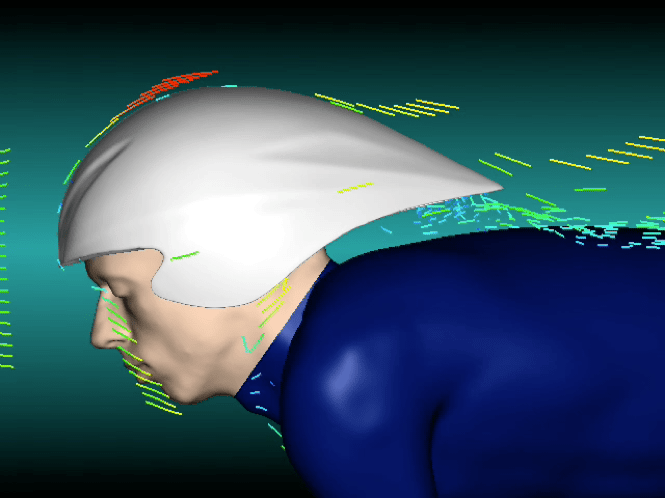
Airflow over an aerodynamic helmet in the cruise position (c) John Hart.
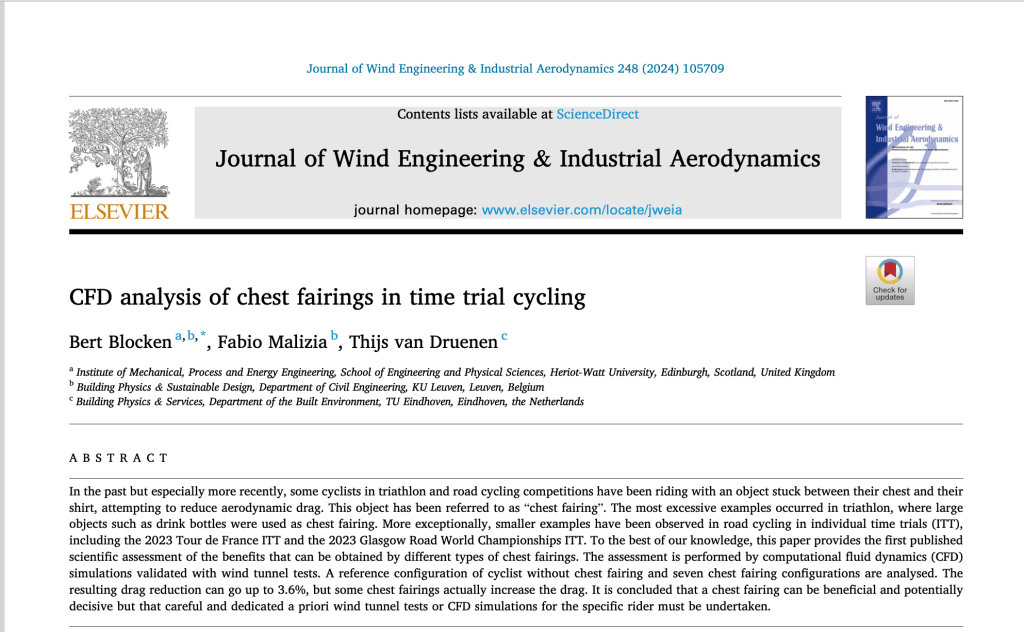
This is possible to some extent for the airflow over the head, shoulders and back, especially with an aerodynamic helmet. But underneath the body along the chest and stomach, the airflow is especially messy and contributes to a large low-pressure wake. A larger shaped chest improves this flow: at Herriot Watt University, Bert Blocken and colleagues carried out some great studies of the aerodynamics of cyclists using wind tunnels and computational fluid dynamics. A 2024 paper showed that a chest faring under the jersey could reduce drag by up to 3.6%.
The UCI probably noticed Blocken’s work: this year Jan-Willem van Schip (male) was disqualified for putting a water bottle down his jersey with the accusation that this was to improve aerodynamics (although this was down the side rather than the front). Whether anyone on the women’s tour has tried anything is now a moot point as the UCI will be checking before time trials whether they are wearing anything unusual in the chest area.
Like the controversy over penisgate earlier this year, how they’ll do this and what exactly the definition of ‘unusual’ is, isn’t clear.
Switching off the computer for the last time is weird. The day after retirement, everything is disabled: email, network access, software. Switching off the brain is a lot harder. I still have a paper or two to write but suddenly I find that I have to buy a new computer and pay for Microsoft (admittedly for the first time ever). I need to take a deep breath before I buy the licence for that statistics package I’ve taken for granted all these years.
I’ve managed to wrestle my 20-year-old mobile number away from the industrial complex that is the University for continuity. Apparently, all I needed to do was to find the right person to ask but, blimey, that was hard. I still haven’t decided if keeping my number is a good or a bad thing. Do I want to be found? Time will tell.
Forwards and backwards
I tend not to dwell on things past: onwards and upwards is my approach. But, it’s hard not to reflect on your career when you retire. I’ve found that memories suddenly jump into my brain at odd moments: events, people, conferences. It’s surprising how many involve alcohol.
It’s been a blast. Working with the sports engineers at Sheffield Hallam University has been the pride of my life. It always seemed to me that we were a group of explorers making our way in the world, enjoying the journey and wondering exactly where we were going. It turned out to be the Advanced Wellbeing Research Centre in Attercliffe.
Monday 3rd August 2026. Each week, between 2.30pm and 3pm, I talk to Sonja McLaughlan on Track Radio about technology and sport. Following a dramatic weekend of boxing at the Commonwealth Games, this week we talk about whether AI can judge a boxing match.
Dimeji Shittu vs Ankush Panghal
In Glasgow this last weekend, Dimeji Shittu was beaten by India’s Ankush Panghal in the gold medal bout. Shittu started off well, winning the first round unanimously. He was then deducted points by the referee for ducking his head too low and Ankush was judged to have won the last round, winning the bout overall.
Commentators weren’t happy, feeling that Shittu was by far the better boxer and should’ve won: the judges clearly disagreed. Given that scoring is so subjective, some have asked whether AI could replace judges, make it fair and far more transparent. Is AI up to the job?
This is my personal take.
iBoxer
If we’re ever going to use AI, then we’ll need data, and lots of it. Between 2008 and 2012, Dr Simon Goodwill from the Sports Engineering Research Group at Sheffield Hallam University developed a system for GB Boxing called iBoxer. It is now in its fifth Olympic cycle. Its task was to gather as much information as possible on all aspects of a fight so that tactical decisions could be made on how to approach a fight against known opposition. Video was always included.
One thing they created was a punch counter. Performance analysts watching a fight would track punches manually by pressing buttons: this allowed them to look at their total number, timing, the momentum of the fight and so on.
At their training base in Sheffield, GB Boxing also have a unique bird’s eye view of the ring which allows coaches to look at positioning, distance between the boxers and movement across the ring. All this information, combined with intelligence about every boxer they might encounter has helped GB Boxing to punch above their weight (apologies for the pun).
What would AI have to do to judge a bout?
Pass lots of exams for a start. But in terms of specifics, we need to first ask what does a judge does that AI would have to copy (and do better).
In an amateur bout, there are five boxing judges watching around the ring, all with a slightly different view. The simplest part of their task is to assess the number and quality of punches. But that’s the least of it. They also look at positioning, who is advancing, who is retreating, who is holding the centre of the ring. They try to figure out who is in control, which boxer has a clear strategy that appears to be working. If this sounds all a bit opaque, it’s because it is. A lack of transparency is one of the key criticisms of judging in boxing.
An AI system, then, would have to be video based, and would track all parts of the boxers’ bodies around the ring. It would assess boxers objectively with a set of pre-defined metrics about number of punches, punch quality, hit points, movement across the ring, momentum and control.
Quantifying these from video isn’t easy. Even counting punches is hard. Was there contact? Was it a glancing blow? Did it affect the opponent? I once asked a boxing coach what the definition of a good punch was.
“Ooomph,” he said, doing some sort of air punch with his fist.
“One with realpower,” he added.
That was all I got. He knew instinctively what a good punch was from looking at hundreds of fights, but couldn’t really come up with a useable definition. In physics terminology ‘power’ isn’t even the right word (throughout the sporting world power is used as a proxy for force or impulse). An AI system processing video might be able to estimate impact forces using Newton’s laws much like Hawkeye and other systems use lift and drag forces to create trajectories of the ball around a tennis court or a football stadium. But calculating multi-body forces of boxers from video is a whole new ball game (apologies for another pun).
A different approach would be to ask lots of judges to assess the same videos of boxing matches, score them and use the results to train an AI system. But then we’re back to the original problem: judges aren’t consistent and the AI would inherit the inconsistencies.
An AI judge: Oleksandr Usyk vs Tyson Fury
And yet it appears to have been done. In 2024, an AI judge ran alongside three judges in a professional fight between Oleksandr Usyk and Tyson Fury. The only thing I could find out about the AI judge was that it gave the same result as the human judges (an Usyk win). There was no information on how it worked and no data came out apart from the final score.
My guess is that it was probably an automatic punch counter with statistics attached, although I’m happy to be proved wrong. The lack of transparency is really not helpful. We need to be able to trust systems like this and we can only do that with the evidence before our eyes.
How AI might help
GB Boxing have arguably the best boxing performance analysis system in the world (of course, I would say that). Often the boxer has to beat both the opponent and the judges, particularly in fights with a partisan crowd. Shittu had a game plan and knew exactly what he was supposed to do to win. He was magnanimous in defeat.
“Whatever the referee says goes”, he said.
“If I’m sitting here blaming judges, blaming refs,” he said, “I’m not going to get better.”
He and the coaches will look at the bout afterwards to see what went wrong. Given the immense amount of information in the iBoxer database, they might even be able to understand how much was boxer error and how much was judging bias. Training an AI model with the data might enable them to predict what to do to guarantee a win if a similar opponent, judges and referee came up again.
I should imagine, not losing two points for ducking his head will be a start.
Thursday 30th July 2026. Each week, I talk on Track Radio about technology and sport on Sonja McLaughlan‘s afternoon show (between 2.30 and 3pm). This week’s topic is about analytics, AI and scouting in football.
Question: What’s the link between Florence Nightingale and the Premier League?
Answer: analytics
Back in 2008, my research team was appointed as an innovation partner by UK Sport, tasked with helping our Olympic teams get new medals. We’d mostly been involved in structural aerodynamics, design and testing but what we were about to find out was that our Olympic sports didn’t want that from us any more. That was for the big teams like of BAE Systems, McLaren and Frazer-Nash. It seemed that most of the coaches had read Moneyball, the best-selling book by Michael Lewis and what they now wanted was analytics.
If you don’t know the Moneyball story, it’s about how the cash-strapped Oakland Athletics baseball team from California matched the spending power of the bigger and richer baseball teams. The hero of the story was Billy Beane, the general manager of the Oakland A’s. Baseball was run by those who made decisions through intuition, gut instinct and experience, those with the arrogance to stand in a room of tobacco-hawking men and stare them down.
Beane, however, had been introduced to the research of a baseball fanatic called Bill James who had manually collected baseball data and analysed it. He had one question: What does it take to win? He created an equation that predicted how many runs a team would get using just two pieces of information for each player. It was remarkably accurate. He quickly showed that the coaching dogma spouted by the baseball fraternity was all wrong.
Of course, he was dismissed by the power brokers because he threatened their control over the game. How could a stats nerd like James, who’d never played baseball in his life, know more than the seasoned pros who’d been in the game since forever? Despite this, Beane employed a Harvard graduate to expand on James’ research and help him assemble a new team based on these radical ideas. The A’s improved dramatically and went on to get the longest continuous series of wins of all time, 20 wins in a row. Beane rejected a $12.5 million job offer from the Boston Red Sox and his fame was secured when Brad Pitt played him in the 2011 movie of the book.
The Moneyball effect was swift and the rest of the sporting world woke up to the new world of analytics. My dictionary tells me that analytics is ‘the systematic computational analysis of data or statistics’; it might be new to sport, but people have been doing it for centuries.
19th century analytics: Florence Nightingale
Florence Nightingale c. 1860 (Henry Hering (1814-1893) – NPG x82368 from National Portrait Gallery, London)
You may have heard of Florence Nightingale – she was the nurse who looked after soldiers in the Crimean War in the 1850s. The classic image of her is as ‘the Lady with the Lamp’, wandering around darkened wards in the middle of the night, caring for frightened soldiers near to death. What you might not know is that she was also brilliant at analytics.
She collected data on the causes of death of her soldiers and showed the government that very few of them actually died of their wounds: most of them died because of the unsanitary conditions of the hospital itself. She presented the data as a beautiful pie chart so that it was easily digestible by the politicians and suggested they put in better sanitation. It worked. She then used the same approach over the next couple of decades to lobby for better sanitation and conditions back in Britain. The Public Health laws she promoted increased the lifespan of the average Briton by around 20 years.
Analysis is something scientists do every day of their lives, but what Florence Nightingale realised was that not everyone likes numbers. If you want to convince someone of a course of action, then you need to make the numbers palatable. Her pie charts were some of the earliest examples of what we now call infographics, one of the key components of modern analytics.
“The ability to learn faster than your competitors may be your only sustainable competitive advantage.” Arie de Geus.
Coming back to the 21st century, Scott Drawer, head of Innovation for UK Sport back in the day (and now head of performance analysis at Ineos Grenadiers) was a key advocate of data: he introduced me to this quote by Dutch Business theorist Arie de Geus. It seems perfectly apt for the world of professional sport where winning means trophies and money. And when we talk about sport and money, Football is at the top of that particular leader board in the UK. Football has embraced analytics for a couple of decades now and is now starting to tinker with AI to make things work faster and get that quick competitive advantage de Greus talked about. Most Premier League teams have an analytics team, with many building their own proprietory IT systems. Arsenal’s relationship with their data system provider StatDNA was so good they bought the company.
Some data can be recorded using wearables either in training or in a match to give speed and position data. A lot of data is manually coded from video: passes, tackles, interceptions and so on. What is certain is that there is a lot of data and many variables to choose from. Undoubtedly, AI will help with the processing of some of this data but there is still a lot of manual input.
Train an AI system with enough real-world data and it can make predictions, but only within the bounds of the original dataset. Trying to predict the performance of professional women footballers is unlikely to work if the AI was trained on men’s data. The signing of Mo Salah and Andrew Robertson by Liverpool is often cited as an analytics-aided decision, although whether it was using an AI-driven system is unclear.
What is clear, is that a lot of data is being collected on players across the world. Teams like Brentford and Brighton appear to be able to punch above their weight (to mix in a boxing phrase) while Teams like Liverpool, Arsenal and Chelsea use it to predict how players might fit into their team’s systems.
I suspect that for the big decisions, a coach is unlikely to rely solely on data prediction, not when their neck is on the line. A scout’s task is not just about finding the right players, it’s about reducing regret.
As Florence Nightingale showed us, using data can help us choose wisely but it still needs a real person to make the decision.
Wednesday 22nd July 2026. Each week, I talk on Track Radio about technology and sport on Sonja McLaughlan‘s afternoon show (between 2.30 and 3pm). This week’s topic reflects my recent experience of running in the heat.
Running the Cotswold Way
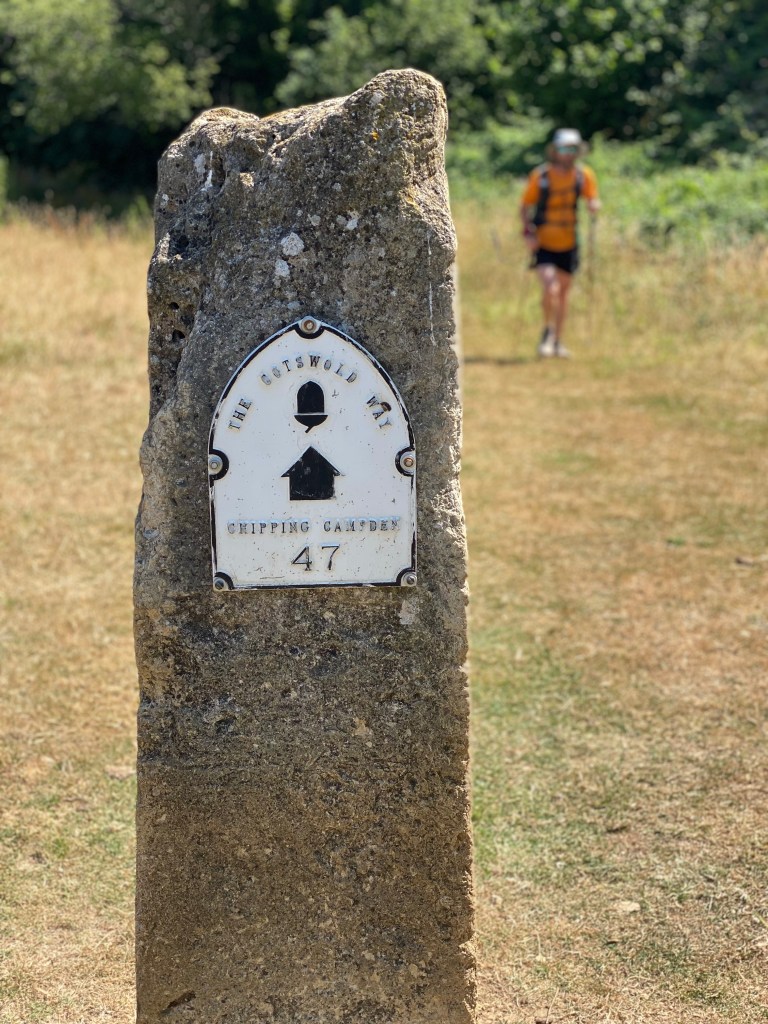
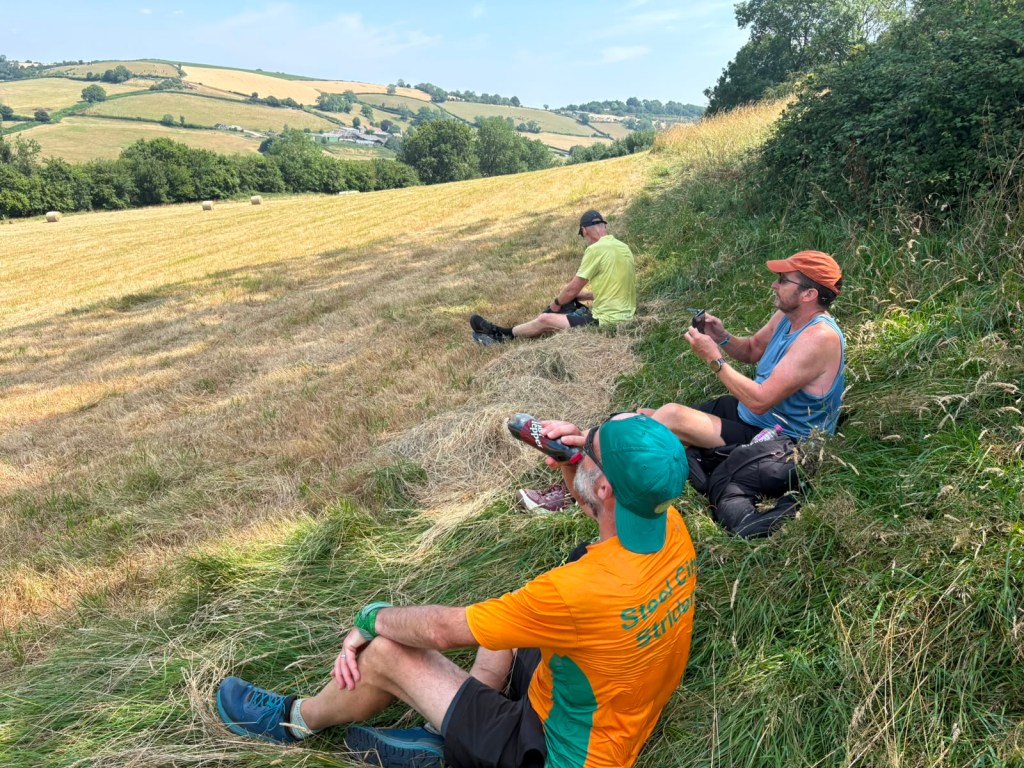
Every year, I spend a week away running with some friends. We try to choose a route of about a hundred miles and do a bit of it everyday over about five or six days. We’ve done the coast of Anglesey, the Isle of Man, the South West Coastal Path (five sections of five days each) and the north of England’s Coast to Coast (two sections of five days each). This year, we decided to do the Cotswold Way, 103 miles from Chipping Camden to Bath. Compared to the other jaunts we’d done, I thought it would be easy but it seemed to me that it was one of the hardest we’ve ever done. I’m certain I spent more time walking than running.
(c) Steve Haake
It occurred to me that the thirty degree heat was probably something to do with it. I spoke to research physiologist Dr Alan Ruddock, to see if this was the case.
The effect of temperature on the body
I asked him about the effect of temperature on the body.
“Once you start exercising in the heat,” he said, “you have a conflicting demand for blood flow. Where does your body send the blood? Does it send it to your muscles which need the oxygen to produce energy to produce mechanical work to run? Or does it divert some blood to the skin surface to help regulate your body temperature?”
In practice, two things happen: dilation of the capillaries at the skin’s surface and of blood vessels in the muscles. This acts to reduce blood pressure and to get back to equilibrium, the heart beats faster. The heart is like the rev counter for your body: the faster the heart goes, the more energy your body is expending and the greater the potential for fatigue. Either you accept that and fuel accordingly or slow down and run or walk at a slower pace.
Josh Kerr’s 1 mile record
On the way home from our holiday, we heard that Josh Kerr had broken the one mile record in a time of 3 minutes 42.66 seconds, knocking about half a second of the previous record.
Reports state that his Brooks running suit was “crafted to enhance aerodynamics and breathability, with laser cut perforations that release heat and humidity while enhancing mobility”.
I asked Alan what the effect of temperature might have been on performance.
“None,” came the reply.
The time was far too short for any effects of temperature to have made a difference. The suit might have enhanced aerodynamics at the speed he was running, but might have had less effect on thermal regulation.
Sage advice for running in the heat
I asked Alan what his advice would have been had I spoken to him before my holiday in the Cotswolds. He advised that a bit of acclimatisation in the University’s climate chamber would have helped my body to get used to the harsh conditions of the likes of Chipping Camden and Old Sodbury. Otherwise he had just one word: